India’s UPI story has been quite a success. So much so that the model is now being expanded beyond India and is now in the process of being replicated by many countries. The purpose of this note is to make a prediction on what kind of growth we are likely to see if we continue to ride on the current growth trajectory — both in Volumes and Value. In order to make this prediction we will be using the linear regression model to fit the curve optimally on the existing data, and then extend the trajectory for making future predictions.
Data Preparation
This I had already explained in detail in my note titled — “Python — RBI’s Settlement Data For Payment Systems”. I encourage the readers to please go through for a better grasp of the content that I plan to lay out in this note for making analysis and prediction.
Forecasting Model
The forecasting model and the strategy used are what I have described in my earlier note titled — “Python — Predicting Indian Nominal GDP in USD”. It will be good for a reader to go through this note for an in-depth understanding of the output that I plan to present. Just like in this note, I have used python’s “sklearn” linear regression module for estimating the predictions.
The Forecast — Value
The following is the chart that captures the existing time series data and its estimated forecasted values.

One can clearly see that by the end of CY 2026, the per month transaction will touch a value close to a whooping Rs 1 Lakh Cr! Assume a Rupee to USD conversion rate of 95. This will be approximately $ 10 billion USD.
The Forecast — Volume
The following is the chart that captures the existing time series data and its estimated forecasted volumes.
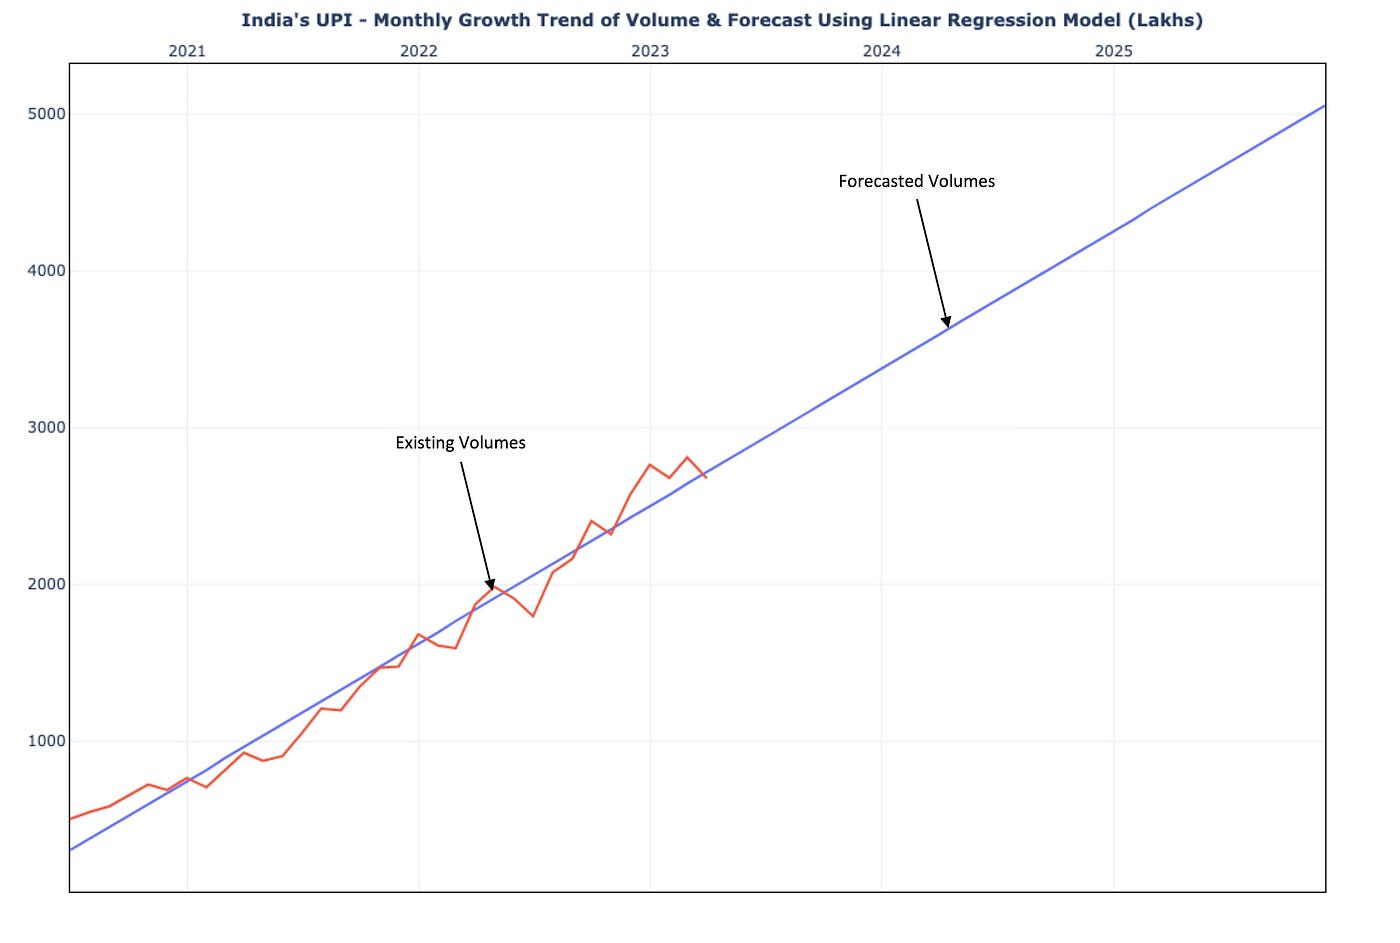
One can clearly see that by the end of CY 2026, the per month transaction will touch a value close to a whooping 500 million!
Analysis
Now given this data, we need to find the value per transaction averaged over the full calendar year. This is embedded in the table below.

One can see that the value per transaction is close to Rs 2K, this is dipping down with time in the future. This points to the maximum number of transactions gravitating towards a very low number in terms of value.
Summary
So if a levy (% fee) is imposed on transactions above Rs 2K, then looks like the impact on overall volumes will be very less. Maybe the high-value transactions will gravitate towards the instruments which absorb the transaction fees or extract the same from the vendor. A more accurate prediction can be made if the further breakdown of data based on category is available for processing. But nevertheless, this level of granularity also helps capture the bigger picture. Many thanks for reading.
(I am aggregating all the articles on this topic here, for easy discovery and reference.)